How Preschool Businesses Capture More of the Demand Already in Their Market
Demand for preschool programs exists. Parents search for early childhood education, local preschools, and kindergarten readiness the moment they decide to start their child's schooling. They enroll with the center that responds first.
The difference between a booked-out preschool and empty classrooms is not the quality of the playground. It is capture infrastructure. Most preschools lose half their demand to missed calls while staff is in the classroom.
Growth in this field comes from visibility during high-intent education searches, immediate response to inquiries, and systematic follow-up. The centers that capture more demand have better infrastructure.
Common Demand Leaks for Preschools
Missed calls during instructional time
Staff are hands-on with children while new parents call. Voicemail reduces enrollment by 70%.
After-hours enrollment research
Parents often research preschools in the evening after work. Centers without immediate response lose these families.
No age-specific targeting
Searches for "2-year-old preschool" or "Pre-K programs [city]" are lost in generic "childcare" ads.
Slow tour or evaluation response
A parent ready to act will book with whoever confirms a tour first. Delays lose most opportunities.
Buying Moments for Preschool
Buying Moments for preschools are situations where a parent has decided to seek enrollment and is comparing options:
Child approaching enrollment age
A child reaching 2 or 3 triggers the highest-urgency search for a program. They enroll in the first responsive and professional-sounding facility.
Upcoming return to work or relocation
Life transitions drive immediate search activity for "preschool near me". They prioritize centers with clear, fast availability.
Frustration with current childcare
Parents searching for "better learning environment" or "academic preschool". A responsive system captures this academic focus.
Seasonal registration windows (Spring/Fall)
Traditional enrollment cycles drive high-volume search activity. A responsive system captures these families.
How the System Captures Demand
The system captures preschool demand through four layers:
Visibility
Ads placed for high-intent searches: "preschool near me", "best Pre-K [city]", "kindergarten readiness program". Listings optimized for specific ages and location.
Capture
Calls answered immediately, 24/7. Enrollment inquiries responded to within minutes. Every family opportunity is captured, not lost to voicemail.
Conversion
AI answering system schedules tours directly. Follow-up sequences for parents who inquired but did not enroll. Buying Moments are converted into students.
Protection
Continuous monitoring of coverage and local competitor age-specific bidding. Monthly reviews show where demand is captured and where it is being lost.
What You See
What you see with this system:
- •Which searches your center appears for and which you do not cover
- •How many calls were answered versus missed
- •Where website visitors come from and what they searched for
- •Which inquiries converted to students and which did not
- •What is being improved next and why
Semantic Demand Matrix for Preschool
Our system doesn't just target "keywords." It maps the technical architecture of Preschool demand to capture the specific jargon and high-intent terminology used by the most valuable prospects in your market.
* This matrix represents a live semantic map used by our Preschool deployments to prevent demand leakage. By capturing the full technical spectrum of your market, we ensure your brand appears when high-ticket buyers search for specific solutions, not just generic service categories.
Real Results for Preschool
Performance Summary
"Localized reviews and availability calendars increased tour bookings."
Results are specific to this business and market. Your results will vary based on your industry, competition, and implementation quality.
Important Notes
Key Metrics Breakdown
System Deployments
System deployments for preschools have shown:
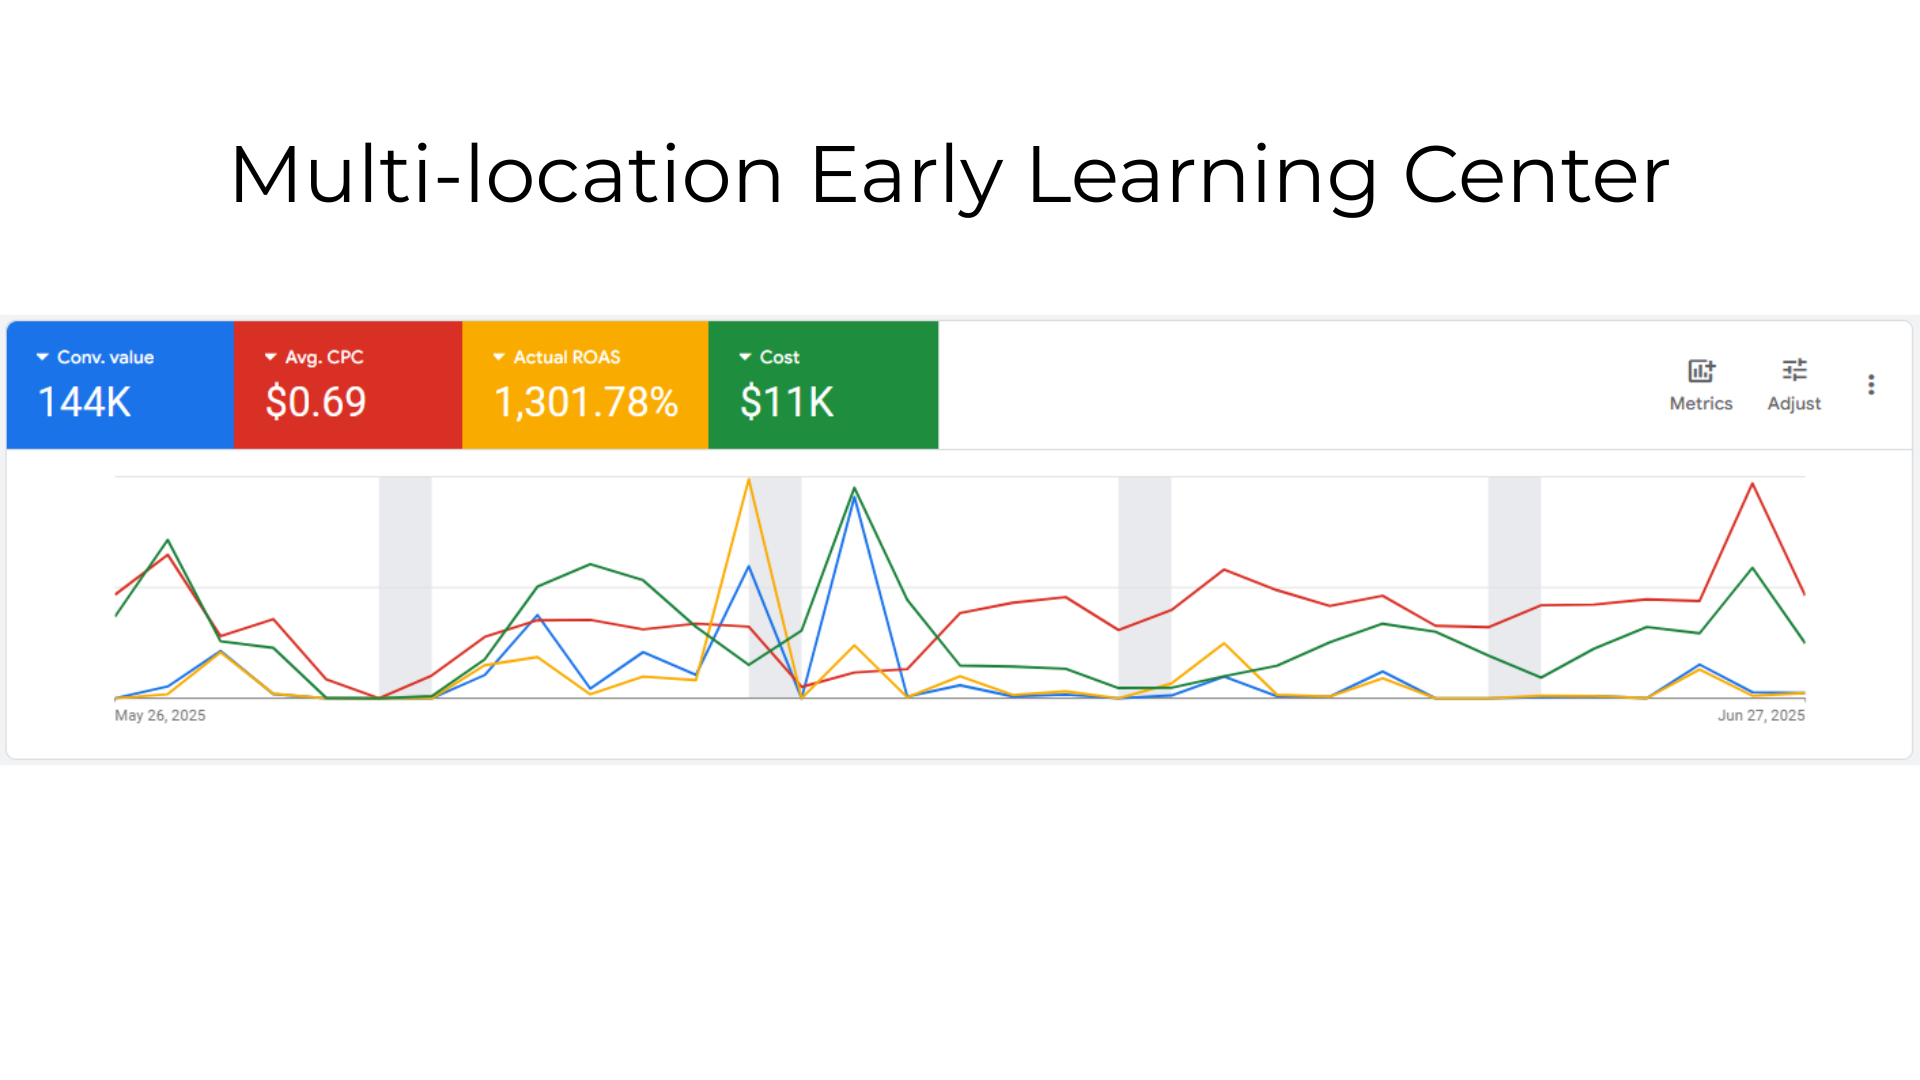
A preschool captured $144K in annual enrollment revenue through age-specific search campaigns and immediate tour scheduling.
AI answering recovered inquiries made while staff was in class, increasing enrollment by 42%.
Localized review campaigns increased trust and high-margin enrollments.
These examples reflect what occurred in specific situations for specific businesses. They are not guarantees, projections, or promises of results. Max Digital Edge guarantees system visibility and coverage accountability - not specific performance outcomes.
Who This Is For
Good fit
- •Preschools with empty spots despite strong local reputations
- •Facilities losing students to large national chains with dedicated call centers
- •Owners wanting visibility into where high-intent academic demand is leaking
Not a fit
- •Preschools expecting guaranteed students without responsive follow-up
- •Owners unwilling to host tours or answer inquiries promptly
- •Businesses looking for marketing hype instead of systematic infrastructure
Common Questions
How we help Preschool capture demand
Demand for preschool exists right now in your market. Prospects are searching for enrollment openings, program information, and immediate availability. You lose opportunities when coverage gaps prevent visibility during these high-intent searches, or when conversion leakage lets competitors capture demand you paid to generate.
Fix Google Ads
Stop wasted spend on broad education keywords and restore tracking for enrollment and program availability searches.
Learn moreBuying Moment Coverage™
Own visibility across age transition, relocation needs, and enrollment deadline moments.
Learn moreAI Answering & Booking
Protect speed-to-lead for tour requests and enrollment inquiries.
Learn moreBuying-Moment Landing Pages
Convert preschool searches with pages built for program information and enrollment decisions.
Learn morePricing
See setup and monthly costs for the demand capture system built for preschools.
Learn moreContact
Request a coverage review to identify where preschool demand is leaking in your market.
Learn moreService Coverage
Preschool Businesses Across the United States
Max Digital Edge builds demand capture infrastructure for Preschool businesses in every major US market. Select your city to see market-specific demand capture insights.
Request a Coverage Review
See where your demand is leaking. Coverage starts immediately.
Request Coverage Review