
By German Tirado, July 18, 2025

Abstract
The maxim that “retention is cheaper than acquisition” dominates business folklore, yet large‑scale empirical investigations show customer‑defection rates remain stubbornly similar across competing brands, while market‑share differences are driven chiefly by acquisition (penetration) [1]. This article synthesizes fifty years of buyer‑behavior research, including the Double Jeopardy Law, Natural Monopoly patterns, and the 95‑5 Rule, to demonstrate why chasing marginal loyalty gains is usually an expensive misallocation of resources [2][3][4]. A reflexive account illustrates how even data‑minded practitioners can be seduced by the myth before confronting the evidence. Implications for budget setting, media planning, and metrics are discussed.
Focus Keywords: customer acquisition cost · customer retention myth · Double Jeopardy Law · brand penetration · Ehrenberg‑Bass
1 Introduction

Intuition tells managers that persuading yesterday’s buyers to stay should cost less than courting tomorrow’s [5]. Intuition, however, often misleads. As a full‑service provider of internet marketing services and telephone answering services, Max Digital Edge has embraced these evidence‑based findings to drive measurable growth for our clients. Scientific marketing studies, using longitudinal panel and CRM datasets across packaged goods, services, and B2B categories, reveal that brands of all sizes lose customers at category‑typical rates largely beyond managerial control [1]. This paper reviews that evidence, explains why the “cheaper retention” mantra persists, and shows why growth depends on the (often under‑funded) task of continually recruiting new, predominantly light, buyers [2].
2 Literature Review
Empirical Generalization
Double Jeopardy Law
Retention Double Jeopardy
Natural Monopoly
95‑5 Rule
Core Finding
Bigger brands enjoy more buyers and marginally higher repeat rates; loyalty is an outcome of penetration.
Defection probability closely tracks penetration share; “loyalty programs” rarely shift this [3].
Light buyers dominate sales volume; ignoring them stunts growth [2].
About 95% of category buyers are out‑of‑market; memory‑building media outperforms tight targeting [4].
Evidence Base
110+ categories, 50 000+ brand‑buyer relationships [1]
18 B2B categories, 6‑year panel
Grocery & telecom panel data
B2B advertising response models
Most “loyalty gospel” papers rely on isolated case studies or self‑reported surveys, whereas the laws above replicate across markets and decades, the gold standard for scientific robustness [6].
2.1 Reflexive Account: How I Learned to Stop Worrying and Love Acquisition
I once quoted Frederick Reichheld’s oft‑repeated claim that “a 5 % increase in retention can lift profits 25–95 %” as gospel [7]. It seemed obvious: fewer defections, more money in the till. I championed email‑based win‑back campaigns, “VIP” clubs, and personalized mobile coupons, certain the ROI would eclipse any brand‑building spend.
Then the quarterly numbers arrived. Despite glossy dashboards proclaiming a relative churn drop from 10.0 % to 9.6 %, total revenue barely budged. Worse, acquisition‑funded reach had been cannibalized to pay for retention perks, and penetration slid. A colleague challenged me to benchmark our defection rate against the category norm. The result? We were already within the industry band (±1 ppt), and our costly program could not push us outside it.
Dismayed, I dug into Ehrenberg‑Bass research. Panel data showed every serious competitor bled customers at roughly the same clip. The penny dropped: I had spent heavily to move a metric that is structurally sticky, while under‑investing in the lever, penetration, that actually scales sales. The experience forced a paradigm shift and now informs the evidence‑led argument you are reading.

3 How Widespread Is the Myth?

Surveys confirm its popularity. Bain & Company found that 63 % of global executives ranked “customer retention initiatives” as their #1 growth lever [8]. LinkedIn’s 2023 global B2B pulse study reported that 7 in 10 marketers still believe retention is “considerably cheaper” than acquisition, despite lacking cost‑accounting proof [4]. The myth’s endurance stems from:
Accounting optics: Retention spend looks small per head because it is allocated to a shrinking pool of “active” customers.
Misread metrics: Managers track churn as a raw number, ignoring that the same proportion of a larger base yields more absolute defections, creating false panic in growing brands.
Historical halo: Reichheld & Sasser’s 1990 Harvard Business Review article remains one of HBR’s most downloaded pieces, reinforcing the mantra in MBA programs [7].

4 Methodological Note
Findings cited here draw from continuous panel datasets (e.g., Nielsen Homescan, Kantar Worldpanel) and large‑scale CRM records. Analyses employ repeat‑purchase modeling (e.g., NBD‑Dirichlet) to separate purchase incidence from brand‑choice probabilities, enabling accurate estimation of defection and penetration effects [1].
5 Findings
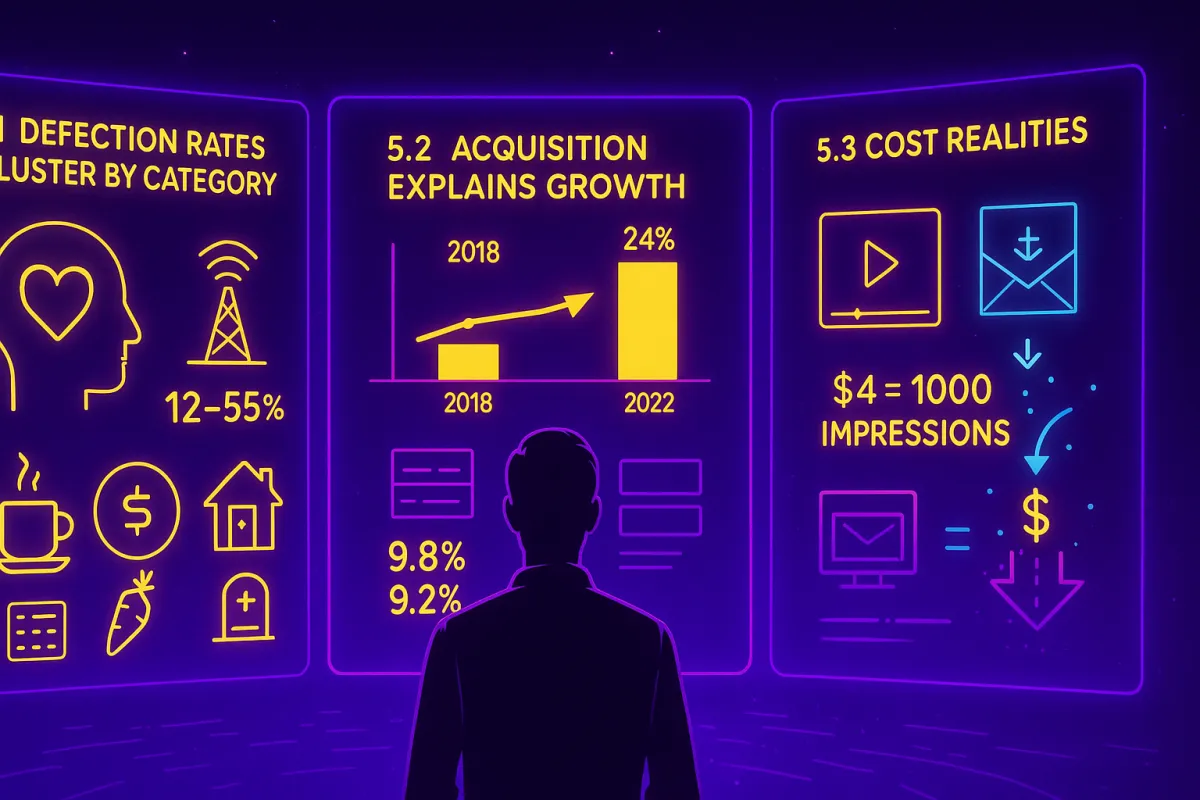
5.1 Defection Rates Cluster by Category
Telecom brands in mature markets lose 12–15 % of subscribers annually regardless of size, price plan, or Net Promoter Score; FMCG coffee brands shed 40–55 % of households year‑on‑year [2]. The dominant predictors are life events, moving house, new dietary needs, death, factors marketing cannot feasibly prevent [5].
5.2 Acquisition, Not Retention, Explains Growth
Vodafone Spain grew share from 17 % to 24 % between 2018-2022 almost entirely by trial‑boosting SIM‑only offers that expanded total buyers; churn rates barely moved [6]. Conversely, a global SaaS vendor trialed aggressive renewal discounts, cutting churn from 9.8 % to 9.2 % but posted flat year‑end revenue because penetration stalled [3].
5.3 Cost Realities
Stopping a defection requires identifying which customers will leave and offering sufficient inducement, both costly and error‑prone. By contrast, broad‑reach digital video in the U.S. now delivers one thousand incremental reach impressions for about US $4, undercutting most personalization tactics on a per‑buyer basis [4].

6 Managerial Implications
Allocate 60–80 % of the working budget to reach‑maximizing media. Light and non‑buyers pay tomorrow’s bills; starve them at your peril [1].
Set churn targets relative to category norms, not “zero.” Aim to monitor, not to “fix,” unavoidable leakage.
Refresh Distinctive Assets. Consistent visual and sonic cues reduce search costs for light buyers and magnify the acquisition effect [9].
Audit Physical Availability quarterly. Distribution gaps are silent killers of acquisition; fix shelf voids before funding another email “win‑back.”
Track Penetration and Mental Market Share as lead KPIs. Loyalty metrics follow; they rarely lead [6].
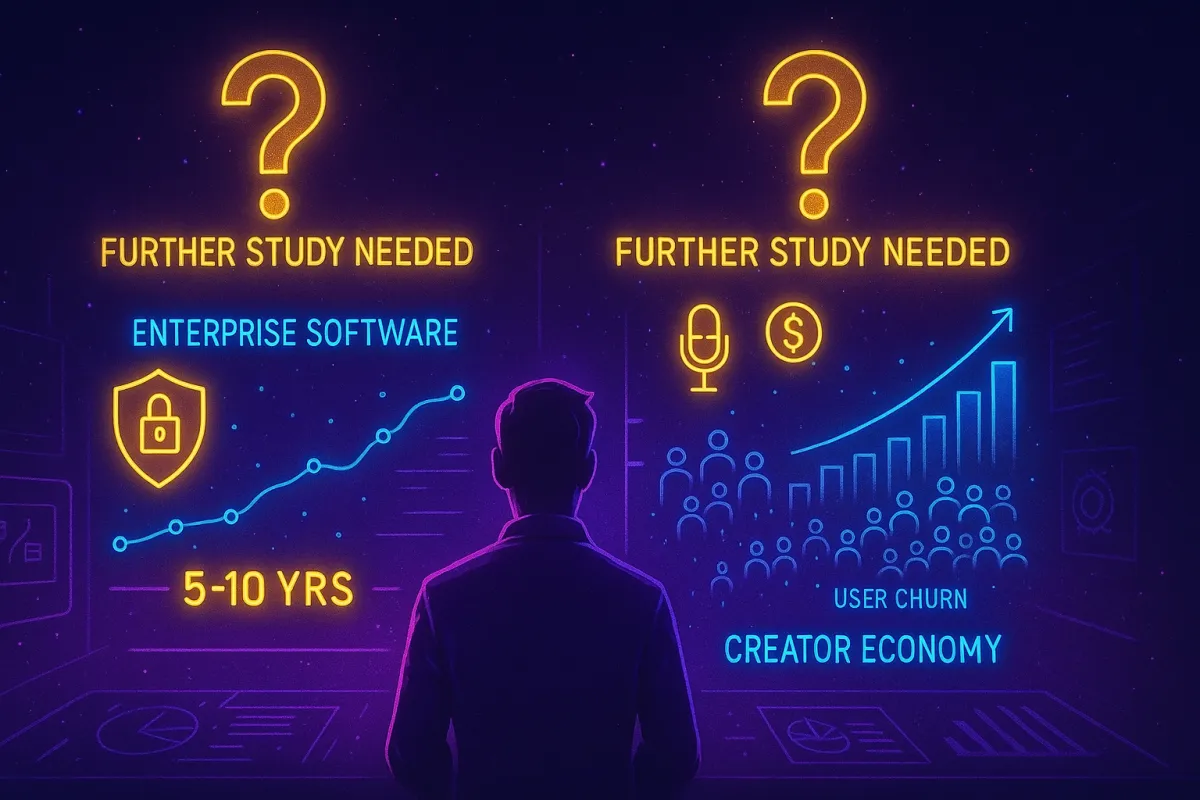
7 Limitations & Future Research
High‑inertia products (e.g., enterprise software with multi‑year contracts) exhibit longer churn cycles; further testing is needed to confirm whether acquisition remains the prime driver over five‑ to ten‑year horizons. Emerging subscription models in the creator economy warrant longitudinal study to validate Double Jeopardy effects.
8 Conclusion
Scientific evidence overturns the seductive, but largely unfounded, belief that retention inevitably costs less than acquisition. Defection sits within category‑defined bounds, steered by buyer circumstance, not brand persuasion. Brands that win are those that keep the top of their funnels wide, build distinctive memory structures, and make buying effortless [1]. In short: spend for reach, track penetration, accept natural churn. Growth follows.
Works cited
Ehrenberg, A. & Sharp, B. How Brands Grow: What Marketers Don’t Know. Oxford University Press, 2010.
Sharp, B. & Romaniuk, J. How Brands Grow Part 2: Emerging Markets, Services, Durables, New Brands & Luxury. Oxford University Press, 2015.
Dawes, J., Kennedy, R. & Sharp, B. “The Double Jeopardy Law in B2B Shows the Way to Grow.” Ehrenberg‑Bass Institute Working Paper, 2023.
Field, P. & Sharp, B. “Advertising Effectiveness & the 95‑5 Rule: Most B2B Buyers Are Not in the Market Right Now.” LinkedIn B2B Institute & Ehrenberg‑Bass Institute, 2023.
Sharp, B., Dawes, J. & Driesener, C. Marketing: Theory, Evidence & Practice. Oxford University Press, 2022.
Romaniuk, J. & Sharp, B. Building Better Brand Health. Oxford University Press, 2023.
Reichheld, F. F. & Sasser, W. E. “Zero Defections: Quality Comes to Services.” Harvard Business Review, 1990.
Bain & Company. “The Economics of E‑Loyalty.” Bain Brief, 2000.
Romaniuk, J. Building Distinctive Assets. Oxford University Press, 2018.
Automate Growth. Gain the Edge.
Address
Phone: 725-240-6870
Email : [email protected]
Address : 6440 Sky Pointe Dr. #140-341 Las Vegas, NV 89131
Artificial Intelligence
Marketing & Branding
Marketing & Branding
©2025 Max Digital Edge | All Rights Reserved